CreateMDHistoWorkspace

Hi, I noticed that ‘CreateMDHistoWorkspace’ only works for cubic arrays.

For example:
input = CreateMDHistoWorkspace(Dimensionality=3,
Extents=‘-8,8,-8,8,-8,8’,
SignalInput=dx,
ErrorInput=np.ones(dx.shape),
NumberOfBins=‘201,201,201’,
Names=(‘[H,0,0]’,‘[0,K,0]’,‘[0,0,L]’),
Units=‘rlu,rlu,rlu’,Frames=‘HKL,HKL,HKL’)

If I load a dataset with NumberOfBins=‘199,201,203’ then the Sliceviewer doesn’t seem to plot the array correctly.
Is this a bug or is there a specific reason why the Sliceviewer can only handle cubic arrays?

Best regards,
Romy

What do you mean by not plotting the array correctly? this array with the setup you have used seems to be plotting correctly?

Hi,

Sorry, I will try to explain the problem better.

When I plot an h5 file with 201x201x201 bins, then the Sliceviewer shows the following:

When I reconstruct the same h5 file in Meerkat with a different number of bins in the three directions (e.g. 199x201x203), then it looks like this:

Since the h5 files created by PETS2 have a different number of bins in the three directions, I cannot visualize them correctly with the Sliceviewer.

Do you have an idea what might be the cause of this problem?

Kind regards,
Romy

Hi Romy,

Harriet asked me to look into this - so at least for fake data (see below) the sliceviewer is fine with non-cubic arrays

nh, nk, nl = 3, 5, 10
intens = np.arange(nh*nk*nl)
ws = CreateMDHistoWorkspace(Dimensionality=3,
    Extents="-8,8,-8,8,-8,8",
    SignalInput=intens,
    ErrorInput=np.ones(intens.shape),
    NumberOfBins=[nh, nk, nl],
    Names=("[H,0,0]","[0,K,0]","[0,0,L]"),
    Units="rlu,rlu,rlu",Frames="HKL,HKL,HKL")

I’m not familiar with how you are rebinning the data (outside of mantid?) - so I think it’s worth checking whether sliceviewer is displaying the data in the workspace correctly or whether it is the rebinning or importing of the data that is causing issues (e.g. reshaping a signal array with wrong row/column order etc.).
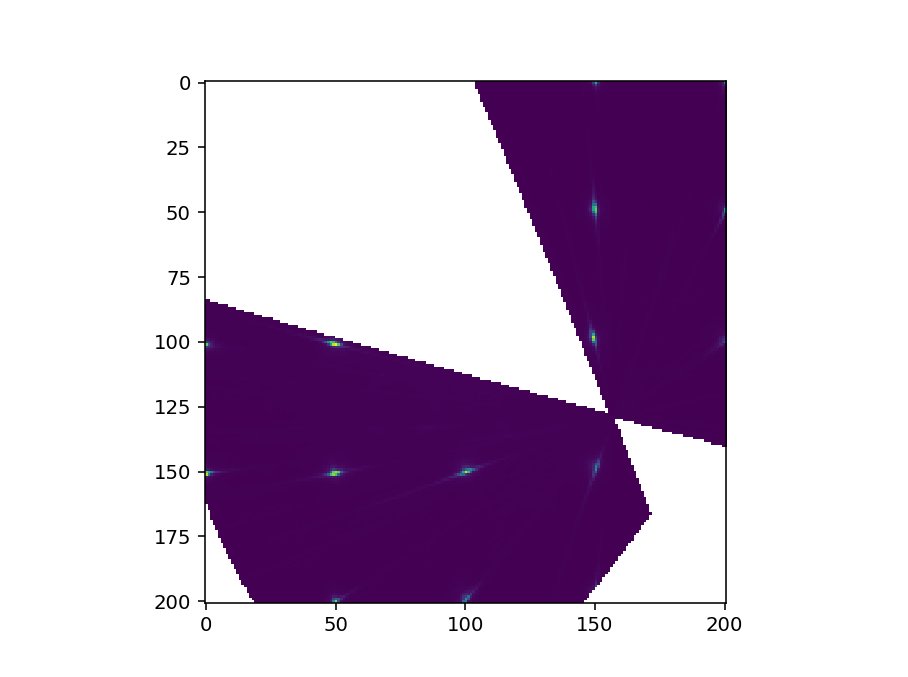
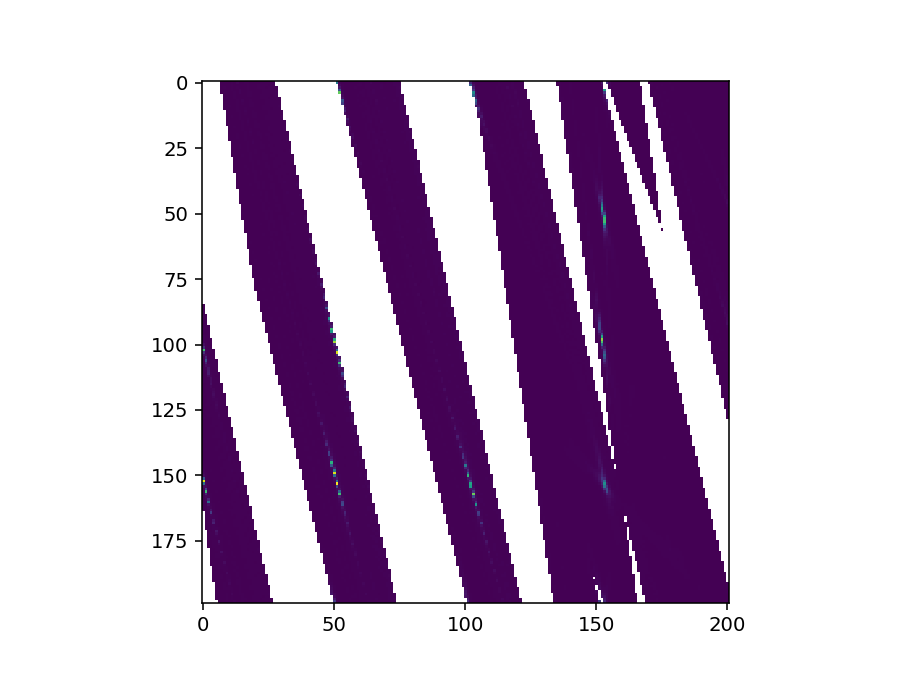
To check this could you just plot the signal array of the workspace like so

fig, ax = plt.subplots()
im = ax.imshow(ws.getSignalArray()[:,:,0])
fig.show()

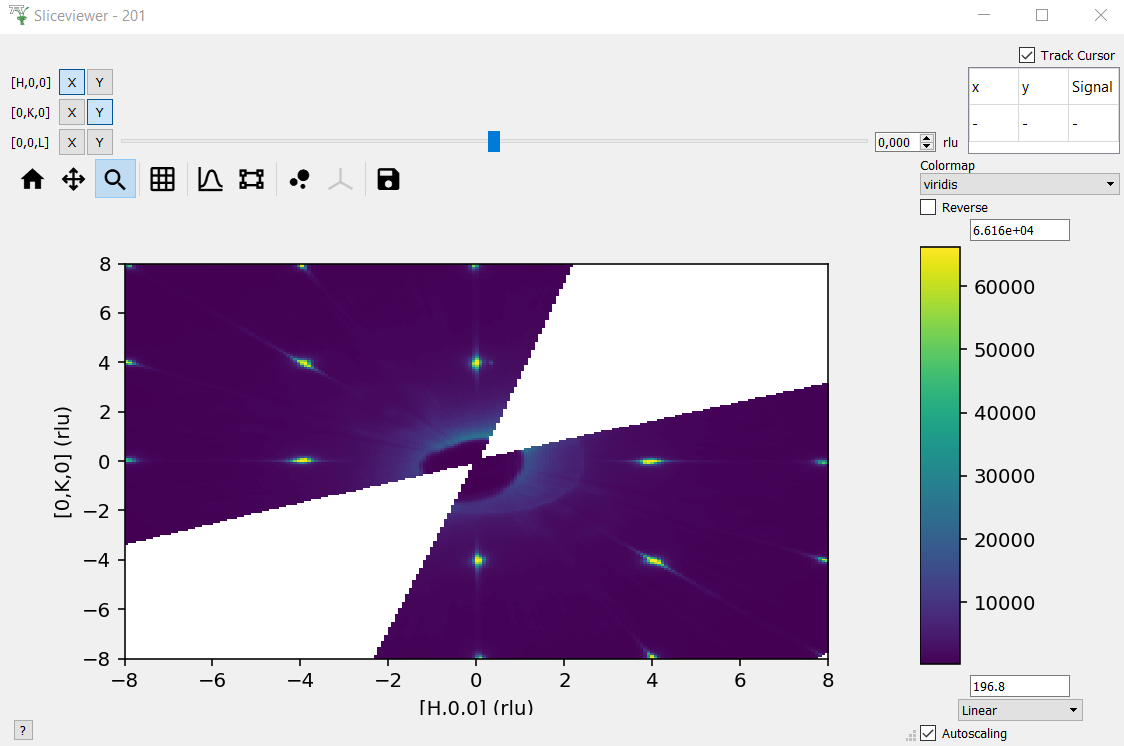
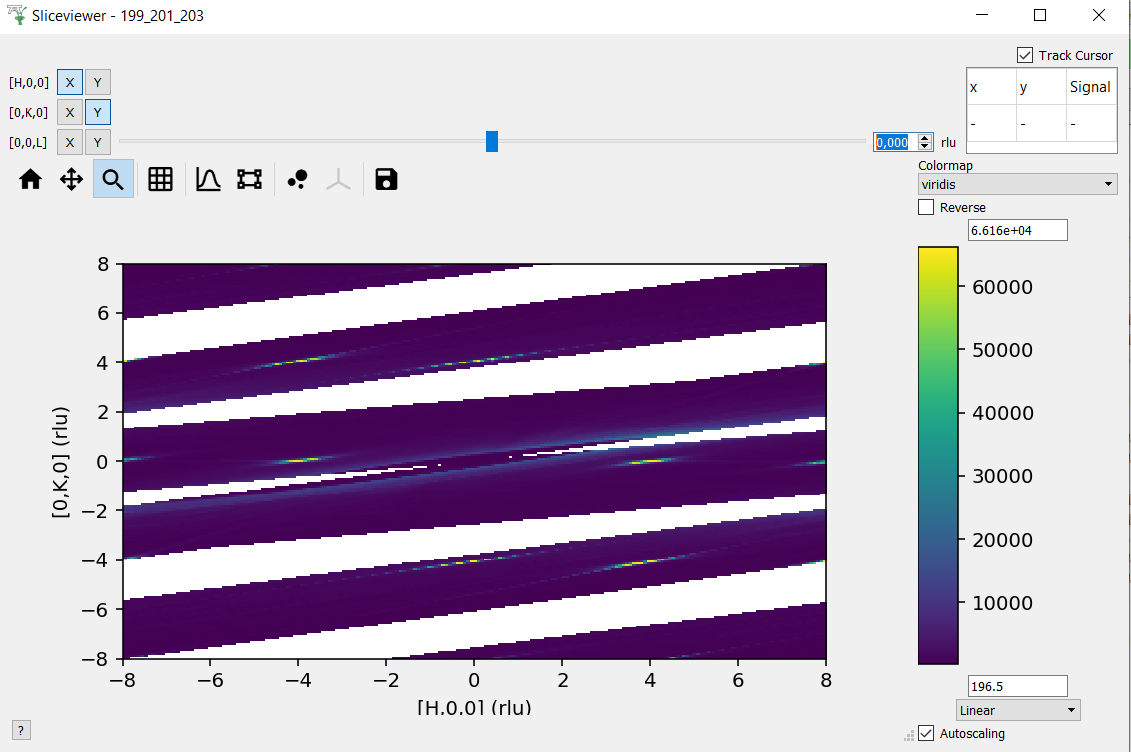
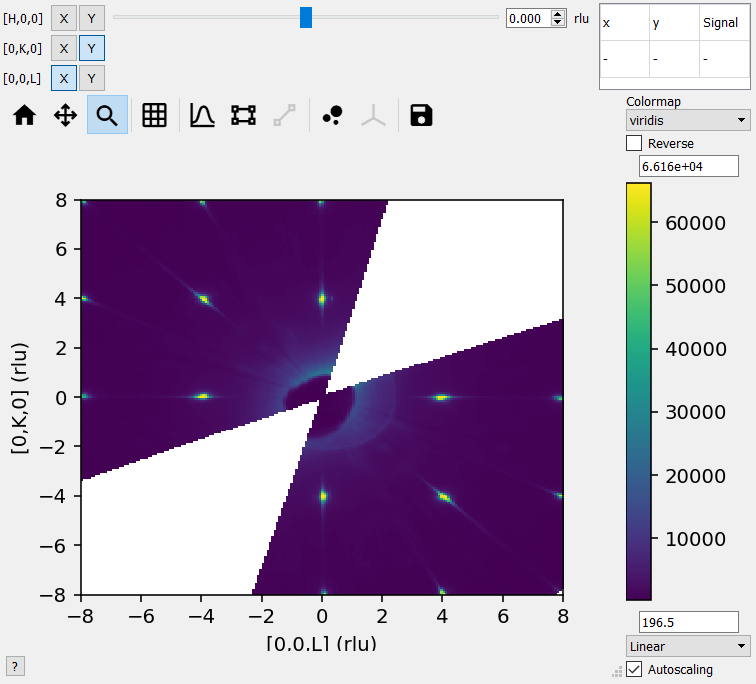
The image will probably be flipped in some way as I haven’t taken care of the extents (that’s why we have sliceviewer to do the work for us!) - but the image should look recognisably similar to what sliceviewer shows. Could you try this and send a screenshot?

Thanks,
Richard

Hi Richard,

Thank you for your answer.

For the h5 file with number of bins = 201x201x201 I get the following:

For the h5 file with number of bins = 199x201x203 I get:

Best regards,
Romy

Hi Romy,

Thanks for the screenshots - so it looks to me like the sliceviewer is accurately plotting the data in the workspace - so the issue is with how the workspace is created. Could you describe how you get the data into a h5 file and from there into mantid? Perhaps attach a script if you are happy to do so?

I don’t know if it is possible but you could also try to save an array such as np.arange(nh*nk*nl) into the h5 file and try to load it in mantid? it might be easier to see what’s going on?

Thanks,
Richard

Hi Richard,

Attached you can find the script that I use the create an h5 file in Meerkat, and also the script that I use to plot the h5 file created by Meerkat in Mantid.

I’m not sure how to save the array np.arange(nh*nk*nl) into the h5 file.

Let me know if there is something else I can help with.

Best regards,
Romy
mantidscript.py (729 Bytes)
meerkatscript.py (588 Bytes)

Hi Romy,

So it’s hard to debug without the h5 file - if I were you I would try to reshape the data array in f['data'] - and try various permuting of axes, transposing etc.

I think it is not so much a bug in mantid, more likely it is to do with the order in which the dimensions of the 3D array has been flattened and stored in the h5 file.

In the CreateMDHistoWorkspace docs it says

Signal and Error inputs are read in such that, the first entries in the file will be entered across the first dimension specified, and the zeroth index in the other dimensions. The second set of entries will be entered across the first dimension and the 1st index in the second dimension, and the zeroth index in the others.

So I read this as the first 199 entries should be along H (between -8 and 8) and at K = -8 and L = -8 - filling up the HK plane with the first 201 sets of 199, before proceeding onto the next L value. Does that sound right?

FYI this is the way to plot a HK slice to agree with sliceviewer

fig, ax = plt.subplots()
im = ax.imshow(ws.getSignalArray()[:,::-1,0].T)  # should look like sliceviewer
im.set_extent([-8,8,-8,8])
fig.show()

Hi Richard,

I noticed that other programs (e.g. Density Viewer, GitHub - aglie/DensityViewer) can plot the h5 files with a different number of bins in the three directions correctly. That’s why I thought that it is probably a bug in Mantid.

It’s not possible to upload the h5 files here on the Mantid forum, but if you would have time to look at the problem, then I could try to share them via mail for example?

Best wishes,
Romy

Hi Romy,

If you are happy to share the file with mantid developers (not distributed beyond us) then you can email
mantid-help@mantidproject.org
and I (or someone else) might have some time to look at it in the next few days.

Thanks,
Richard

Hi Richard,

Thank you. I have sent the h5 files to mantid-help@mantidproject.org.
Let me know if you have any trouble opening the files.

Best wishes,
Romy

Hi Romy,

I was correct - it was an issue with the way the array was flattened.
If you flatten the array using fortran/column-major ordering you get sensible results

import h5py
import numpy as np
from mantid.simpleapi import CreateMDHistoWorkspace
import matplotlib.pyplot as plt

fld0 = r'C:\\Users\\me\\Downloads\\OneDrive_2022-10-06\\h5 files\\'
fname = 'reconstruction_199_201_203.h5'
 
f = h5py.File(fld0+fname,'r')

dx = f['data'][()].flatten('F')  # change order of flattening to fortran/column-major
                           
input = CreateMDHistoWorkspace(Dimensionality=3,
    Extents='-8,8,-8,8,-8,8',
    SignalInput=dx,
    ErrorInput=np.ones(dx.shape),
    NumberOfBins='199,201,203',                         
    Names=('[H,0,0]','[0,K,0]','[0,0,L]'),
    Units='rlu,rlu,rlu',Frames='HKL,HKL,HKL')

Please note you need to call flatten('F') even with the data on the 201v201x201 grid to get the order of the axes correct (i.e. even though the image looked sensible before, it was swapping some axes)

Thanks,
Richard

Hi Richard,

Thanks a lot for finding the issue!

Best regards,
Romy