Hi,
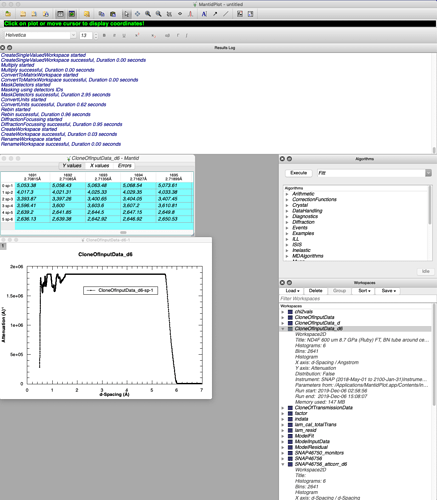
I have created a workspace2D “CloneOfInputData_d6” as part of a data-reduction script. when creating the “distribution” flag was set to false (and this correctly shows in the description of the workspace (see screenshot).
However, the values displayed in the graph created when using “plot spectrum” are divided by the bin width instead of showing the actual values as I want.
I suspect I have done something wrong when creating the workspace ?
Screen shot shows plotted spectrum and table of actual data (the factor of ~369 is the reciprocal of the bin width 0.00271).
Thanks!
As a first guess, does ConvertToPointData on the workspace solve the problem?
I’ve just been having a quick look here.
Interestingly, plotSpectrum actually has a distribution input, but I haven’t seen it affect the outcome on my quick trial.
If you’ve no luck then email me what you’ve got and I’ll take a look! 
I have discovered that when plotSpectrum is applied to a histogram containing raw counts by default what it plots is the frequency (i.e. the raw counts divided by the bin width). This doesn’t reflect anything strange about my workspace as I see exactly the same when plotting the output fresh from a “loadEventNexus”
I am assuming this is deliberate and there is a good reason for it, but it was pretty confusing for me!
I then thought to try plotSpectrum, with “distribution=True”. The logic was: “if plotSpectrum believes that data are distributions already, it will not again divide by bin widths and, thus, will show the actual counts”.
However, my tests show that strangely, independent of the distribution flag setting, plotSpectrum always plots frequencies (counts/bin width). Surely there must be some way to plot the actual y-values in the workspace (counts) without bin division?
(p.s. I read the webpage on histogram data in mantid, that was very helpful and informative, thank you!).
Hi Malcolm,
I had suggested ConvertToPointData as the SNAP46756_monitors_ioio.csv file you previously sent me, loaded as PointData.
I think what you want to do is open MantidPlot > Preferences > 2D Plots and un-check the box beside “Normalize histogram to bin width”
Does this work for you?
This works perfectly! Thanks!
On the ConvertToPointData: my original calculated correction is point data. But then it’s applied by dividing the histogrammed neutron data by it. So, I had rebinned the correction to match the neutron data and this was where my confusion started! I think I understand much more about the difference between histogram/point and frequency/count issues now, so hopefully, shouldn’t have a problem.
Glad this works, sorry for the confusion!

