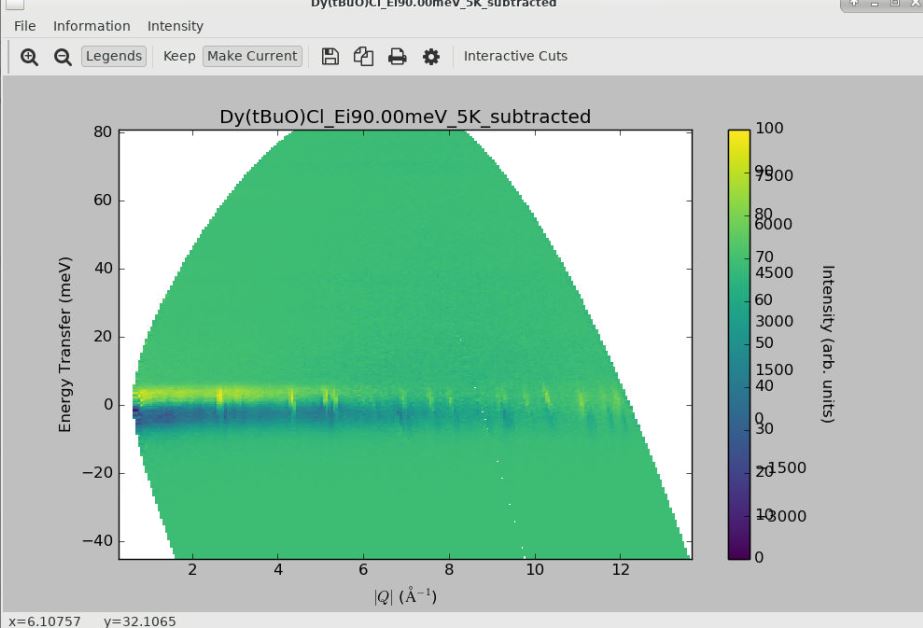
When plotting a figure using an mslice generated script, if we want to modify the intensity ranges for example, it does not work and generates something like the attachment.
Hi. I am unable to reproduce this issue. Please could you provide the script you used to make it?