I have a series of data from ARCS. However, I did not find a good UB matrix when conducting experiment. Now, I would like to try hunting for accurate UB-matrix from these data. My problem are here:
1、Does mantid can get a UB matrix from nxpse data,which were from ARCS(auto reduced)?
2、I tried to use below code, but it cannot find any peak. And thus , it returns error “ValueError: Find_UB(): Four or more indexed peaks needed to find UB”.
Thanks for you if you can help me to solve this probelm, which confuse me about one month.
########code for find UB ,Bold means that they are circulation ##############
from mantid.simpleapi import *
runs = range(103253,103255) for r in runs:
** print ‘Processing run : %s’ %r**
** filename=‘F:\APS-ORNL\arcs\ARCS_%d_autoreduced.nxspe’ % r**
** data=LoadEventNexus(Filename=filename)**
** MaskBTP(data,Pixel=‘1-16,241-256’)**
** LoadInstrument(data, InstrumentName=‘ARCS’,RewriteSpectraMap=False)**
** SetGoniometer(data,Axis0=“omega,1,0,1,1”) **
** ConvertToMD(InputWorkspace=data,OutputWorkspace=‘md3’,QDimensions=‘Q3D’,**
** dEAnalysisMode=‘Elastic’,QConversionScales=‘Q in A^-1’,LorentzCorrection=‘0’, **
** MinValues=’-25,-25,-25’,MaxValues=‘25.1,25.1,25.1’)**
** FindPeaksMD(InputWorkspace=‘md3’,SignalThresholdFactor=1.5,** OutputWorkspace=‘peaks3’,AppendPeaks=True)
FindUBUsingFFT(PeaksWorkspace=‘peaks3’, MinD=4.013, MaxD=10.682)
Hi, I am not familiar with the ARCS instrument but I do not believe the autoreduced data will find a UB.
In principle you only need to index two non-collinear Bragg peaks to find a UB if you already know your lattice parameters and the angles between them - this can be done by running the algorithm CalculateUMatrix. The peaks can be identified manually by looking at the instrument view of the data (output of LoadEventNexus): right-click the workspace > show instrument > ‘Pick’ tab > click the ‘Add single crystal tool’ (icon blue arrow above a red spectrum) > click the detector pixel in the peak centre > click on the peak centre in the spectrum that is plotted in the bottom left. This will create a peak table called SingleCrystalPeakTable in which you can then edit the H,K,L.
If you don’t feel confident indexing the peaks from their d-spacing and/or you do not know your lattice parameters very well, then you will need to identify more peaks (typically >=6) and use one of the FindUBUsingXXX algorithms (e.g. FindUBUsingFFT in your script, or FindUBUsingIndexedPeaks - see related algorithms in the mantid docs for others). In fact FingUBUsingFFT will probably require many more than 6 peaks as you don’t give the algorithm any additional information and you need to give it enough frequencies (Bragg pekas) to do the FFT. If you use a method that doesn’t take H,K,L indices then be careful if your crystal has any form of centering etc. the algorithm may index them in the primitive rather than conventional cell.
In general, the more peaks you find the better constrained the UB will be, which means that you may want to find the peaks in an automated way. There are two algorithms to find peaks, FindPeaksMD which you have in your script which acts on an MD workspace (I believe it should only be a diffraction workspace, e.g. only Q dimension, no energy transfer), or FindSXPeaks which acts on the matrix workspace (that you viewed with show instrument). Both of these algorithms require some background tolerances to identify the peaks which may need some optimising. I tend to use FindSXPeaks because it is easier to determine an appropriate background level (from the plot of each spectrum in the instrument view). I recommend using the ‘AllPeaks’ finding strategy and using absolute resolution values (tolerances by which to merge peaks that are close together). Once you have a UB you can use the same for all your runs at different goniometer angles if you use SetGoniometer as in your script.
Hope that helps, let me know if you any additional help or clarification.
Thak you for your reply. It help me a lot.
I have checked my data. I do not have diffraction data.My data is from inelastic neutron measurement(ARCS). I think I should extract peak information near 0 meV, which I want to use to replace diffraction data.
My probelm is that:
**1,I do not know whether my idea is feasible to get UB from inelastic measurement data?
2,I do not know whether Mantid have this fuction(extract peak information near 0 meV from *.nxspe) **.
Hi, although the data are inelastic, because the instrument has such a large detector array even with a fixed Ei you should still see multiple peaks that can be used to make a UB. I think it is best to try identifying the peaks in the matrix workspace - the output of LoadEventNexus before you make the MD object. Perhaps you could show a screenshot of what the instrument view looks like?
Thank you for your replying. I adopted your suggestion though I did not totally understand.
Actually, I am a greenhand for coping with neutron scattering data. I tried to understand how to identifying the peaks .
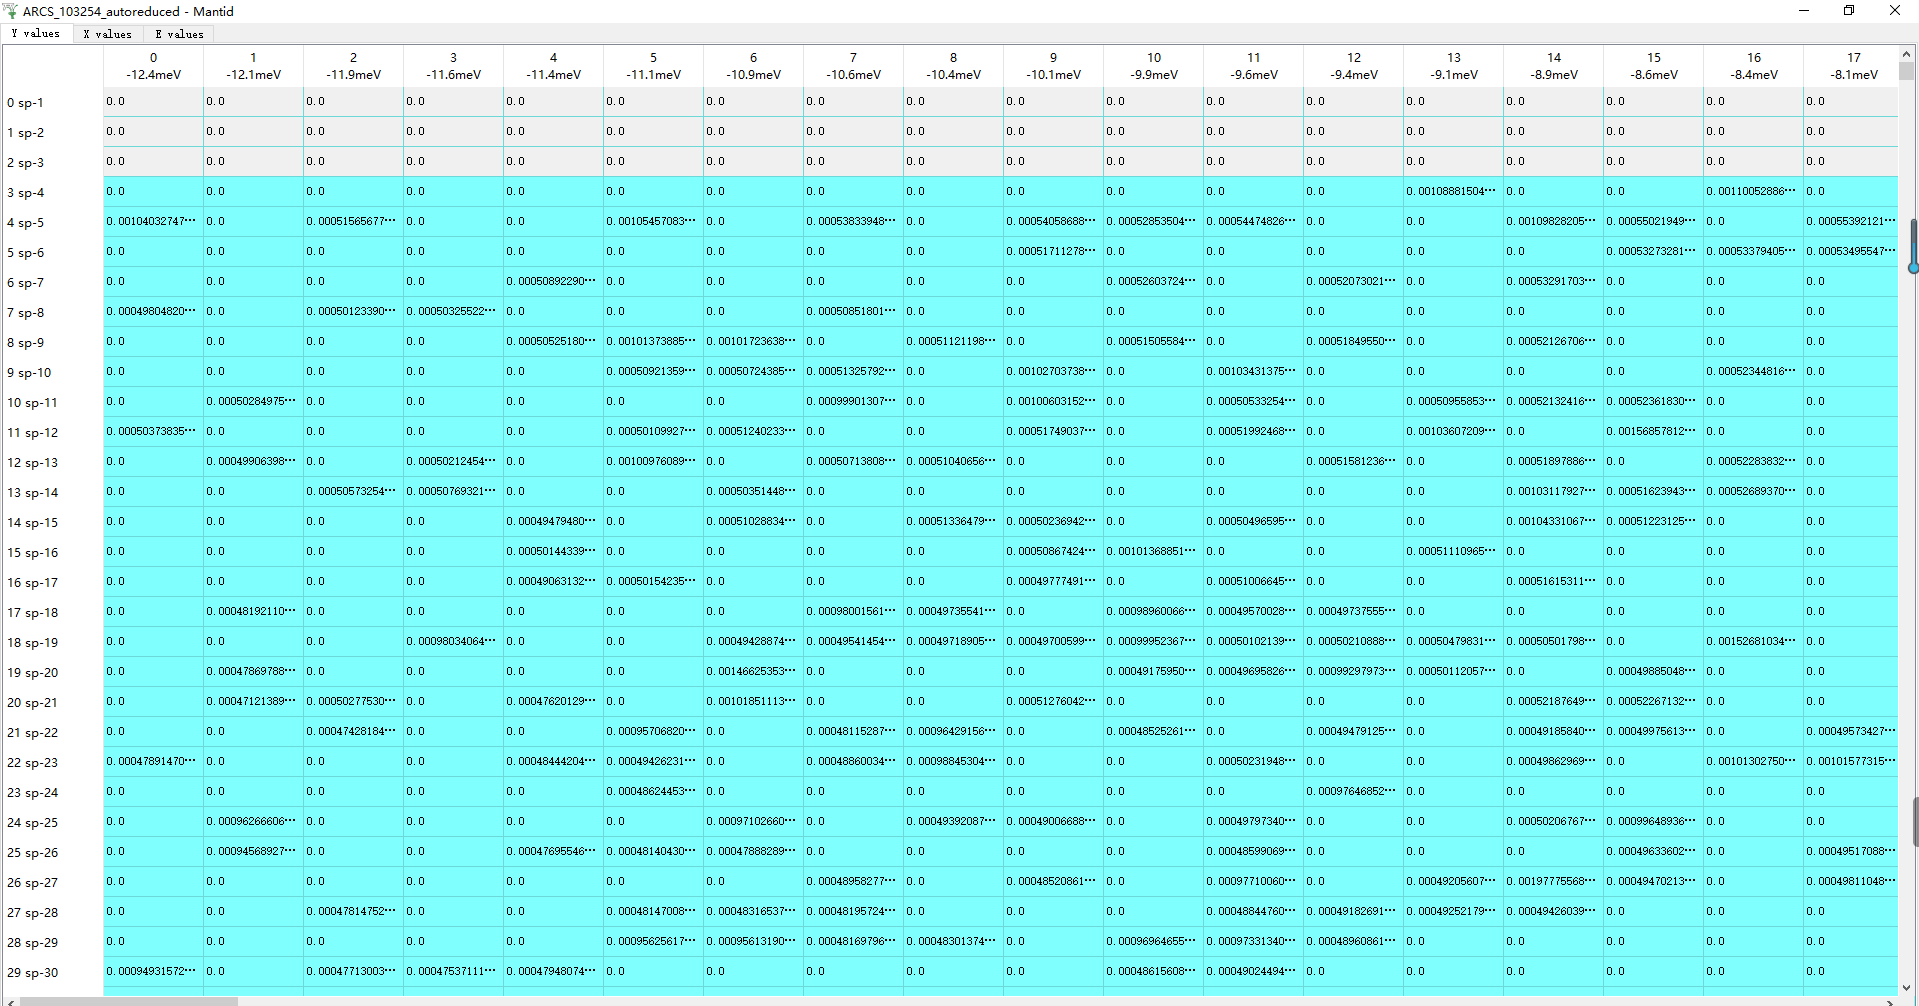
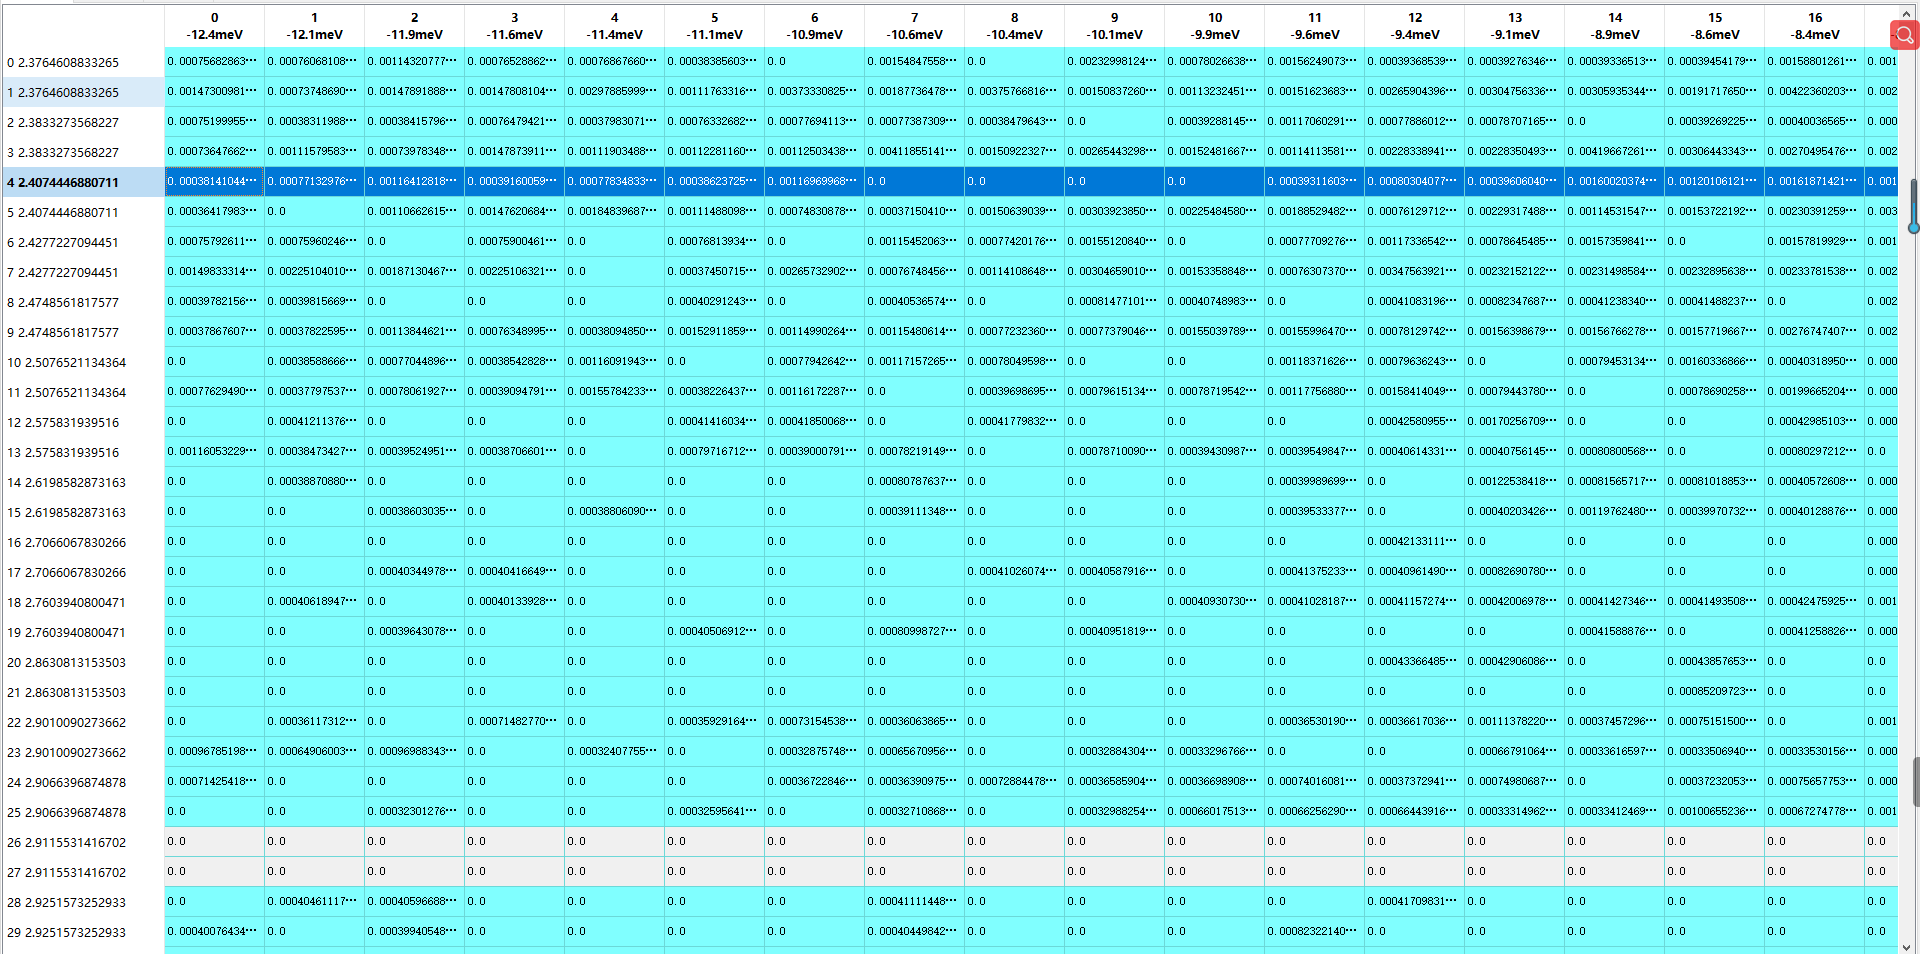
However, just like in above picture, there are E value and many other data(I am not sure the the leftmost column sp-** is detector id), It looks like that I can not find peak in this maxtrix workspace directly(I think I did not find correct method for doing that).
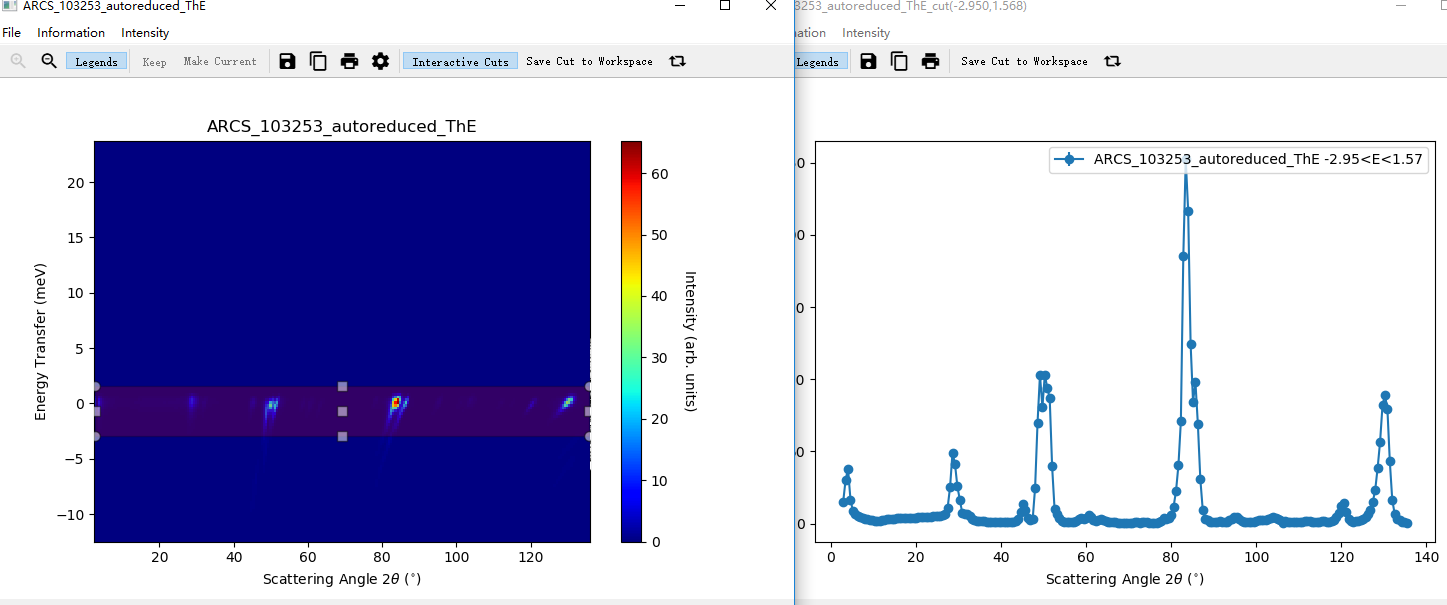
I tried another way to find peak. just like below picture.
I used Mslice and tranfer data to 2theta~Energy, and then I cut data around 0meV. Finally, I got picture this picture. It is like data from X-ray in which there are some peaks at specific angle. However,I do not kown how to get UB from this picture.Can Mantid identify these peaks by some ways?
 It confuse me for a long time.
  Thanks