I need to perform Crystal Field analysis on some powdered neutron data.
My first attempt was to directly use the .nxspe data, however a few errors arise:
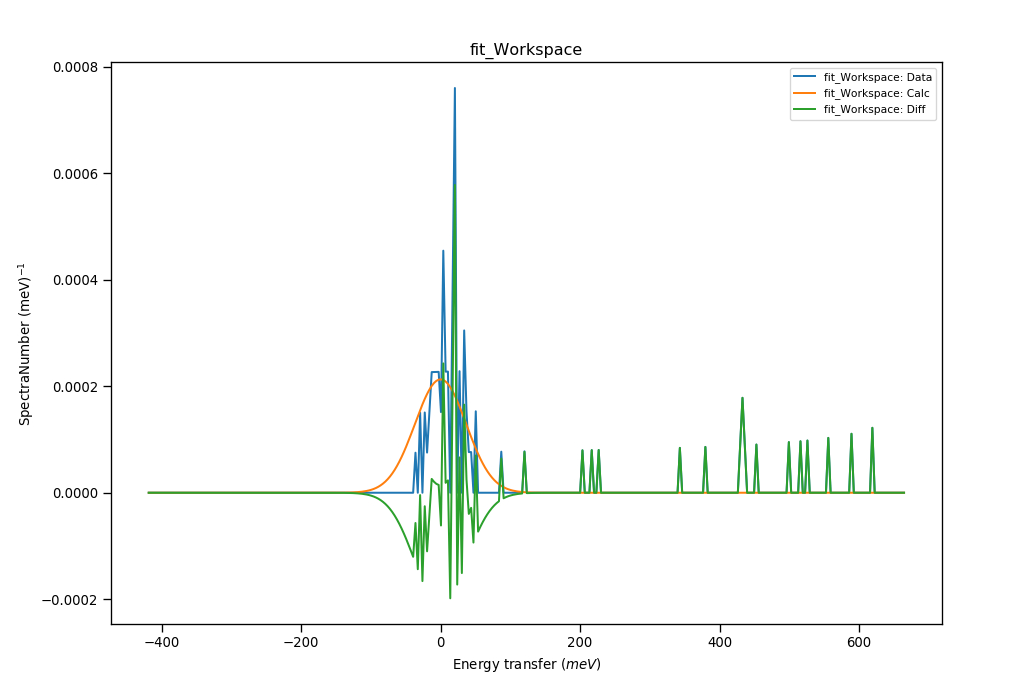
The elastic line is significantly more intense than the magnetic modes. The fit attempts to only capture the elastic line and we can only see other signals in the difference.
There are too many signals present, such as phonon modes.
My second attempt as recommended by a colleague is to create pure gaussians of ONLY the magnetic modes. (I fitted the relevant magnetic modes from I(E) data using LMFIT). I used the fitted parameters (amplitude, width, height) to create the gaussians for the 3 magnetic modes.
However CrystalFieldFit no longer produces any sort of line shape.
Any guidance would be appreciated as to whether I should use my simulated gaussians or if there’s a better way for me to use CrystalField with the raw data set.
your original data looks very noisy - is the integration range correct? Note that you can’t do a Q/2theta integration on the nxspe file directly, you have to use either ConvertSpectrumAxis (to theta) or SofQWNormalisedPolygon (to |Q|) and then use Rebin2D or the SliceViewer to rebin the data. I would expect the CF peaks to show up better than the spikes that you showed despite the large elastic line.
Also, your energy spectrum seems to be at very high energies (300-400 meV) which implies that the lower |Q| measured is also quite high, so the magnetic form factor will affect the relative intensities of the mode at 180 meV and the modes at ~340 and 390 meV significantly (and possibly between the 300 meV modes depending on spectrometer configuration). However, Mantid doesn’t really have a robust mechanism for correcting for the form factor at the moment.
If you carry on with the simulated Gaussians, then you should calculate the mean |Q| range for each peak and scale them by the formfactor at those positions. If you’re going this route, the other thing I would advise is to forget about using the Fit algorithm in Mantid with peaks - this just adds the complications of peak widths etc, and just fit the peak position and area (not height) directly - you can get the calculated peak position and cross-section using the getPeakList method of the CrystalField object - this returns a 2-row numpy array where the first row is the list of peak centres and the second is the corresponding cross-sections, ordered by the most intense (highest cross-section) peak first. You can then write a Python function to calculate a cost function for your set of peaks and then use a scipy minimiser to optimise the parameters.
If you go with fitting the measured spectra instead, you might try to use the MagFormFactorCorrection algorithm but this has issues if you have strong phonon scattering in your data, which you imply you do.
In any case I might be able to give you further advice if you give some details of what system you’re trying to fit. The best strategy depends a lot on the details of the system.